
Data analysis and visualisation
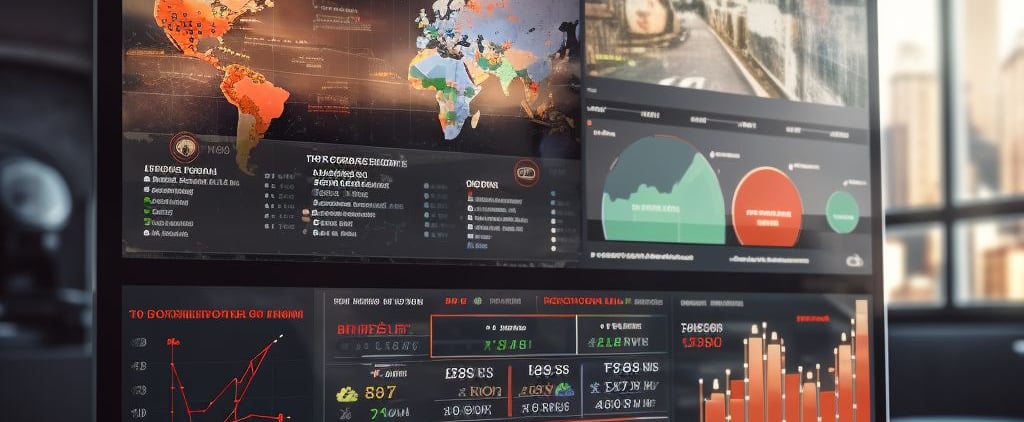
We analyse data to help you understand spatial differences, changes and relationships between key indicators. We present results through maps, graphs, charts and GIS dashboards.
We connect different views and add filters so users can explore the data themselves. These solutions support monitoring and planning and help communicate information clearly to colleagues, managers and clients.
© 2026 NordicGIS · UAB “Invictus verus”
Privacy policy · Contact us